The method
How Overbar works out your first pull-up date
Overbar estimates how much of your body weight you can pull today, then how fast that grows with your training, and finds the week it reaches one pull-up. Your answers set the start until Day 1 measures it; your days, minutes, kit, age and any joint pain set the pace. It’s an estimate with a range, updated after every workout.
By Aleksandr Chichkanov, maker of Overbar · Updated October 27, 2026

The app, the first pull-up calculator and every number on this site use this one forecast.
The number behind it: relative pull strength
Everything runs on one number: the share of your body weight you could pull for one rep. 1.0 is a strict pull-up. In one study of college students, women’s best single pull-up averaged 0.73 of body weight and men’s 1.16 (Johnson 2009), and the beginners the app sees mostly start between about 0.5 and 0.8.
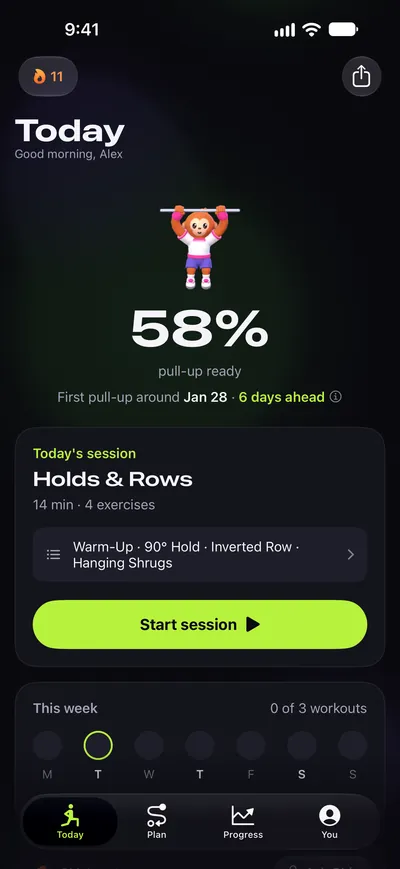
Readiness, the percentage on the app’s Today screen, is the same number on a friendlier scale: 0% is pulling about half your body weight, 100% is one full pull-up. It stays under 85% until your holds and lowers say a try makes sense, and it never shows less than how far through the stages you are.
Where you start
Before Day 1, the quiz’s answers are blended into a starting estimate: 40% your hang, 60% a profile estimate, plus an adjustment for push-ups.
- Your hang: none or under 10 seconds 0.50 · 10–29 seconds 0.58 · 30–60 seconds 0.63 · over a minute 0.66.
- A profile estimate: women 0.65, men 0.75, not said 0.70, a little lower per decade over 40. Height and weight, if you give them, adjust it: a pull-up lifts your own weight, and strength grows more slowly than size. They never change how fast you’re expected to improve.
- Push-ups, a sign of upper-body strength, adjust the blend by 0.3 × (none −0.10 · 1–5 −0.03 · 6–15 +0.04 · 16 or more +0.09).
“I can lower myself slowly from the top” starts you at 0.78 or more; “I could, years ago” adds a little. The stage your answers put you in sets a floor, so the estimate never starts below what that stage assumes.
On Day 1, the app stops guessing. A free check-in times your hang, your top hold, your slowest lower and your rows, and turns them into strength on a ladder that coaches use: about 0.50 with no hang, 0.58 at a 10-second hang, 0.62 at 30 seconds, 0.66 at your first second of top hold or slow lower, 0.75 at a 10-second hold or a 5-second lower, with smooth steps between them. Day 1 sets your readiness and your date from what it finds, up or down. After that, readiness never goes down; a hard check-in moves the date instead.
How fast you improve
About 3% stronger a week at first, easing off over the months toward about 1.35%. The first 12 weeks average about 2.5% a week, which matches the roughly 36% gain the women in the Dayton study made in 12 weeks (Flanagan 2003). The curve counts training weeks, not calendar weeks, so time off doesn’t age it.
Your week then scales that pace:
| Factor | Effect on the weekly pace | Basis |
|---|---|---|
| Days a week | 1 day ×0.6 · 2 ×0.85 · 3 ×1.0 · 4 ×1.1 · 5+ ×1.15 | More sessions add up to more training (Grgic 2018); two days a week is the minimum the ACSM gives for strength |
| Minutes a session | 10 ×0.8 · 15 ×0.88 · 20 ×0.95 · 30+ ×1.0 | Four 15-minute sessions matched two hour-long ones (Kilen 2020); the steps are our choice |
| Age | under 30 ×1.0 · 30–44 ×0.95 · 45–59 ×0.85 · 60+ ×0.75 | Strength training works at every age (Peterson 2010); the steps, and a gentler ramp from 45, are our choice |
| Equipment | a gym ×1.12 · bar and bands ×1.06 · bar or rings ×1.0 · table or bands, no bar ×0.8 · nothing ×0.72 | Our design choice: help that comes off in small, measurable steps (ACSM 2009) and band-assisted reps that teach the movement (Crockford, ACE) |
| Joint pain | none ×1.0 · sometimes ×0.95 · now ×0.85 | Our choice: a gentler plan moves more slowly |
| Already doing 1–3 | ×0.8, aiming for five in a row | Past the beginner’s fastest gains |
Sex is not a factor in the pace. Women gain relative upper-body strength at least as fast as men (Roberts 2020), so sex changes only where the estimate starts.
The date and its range
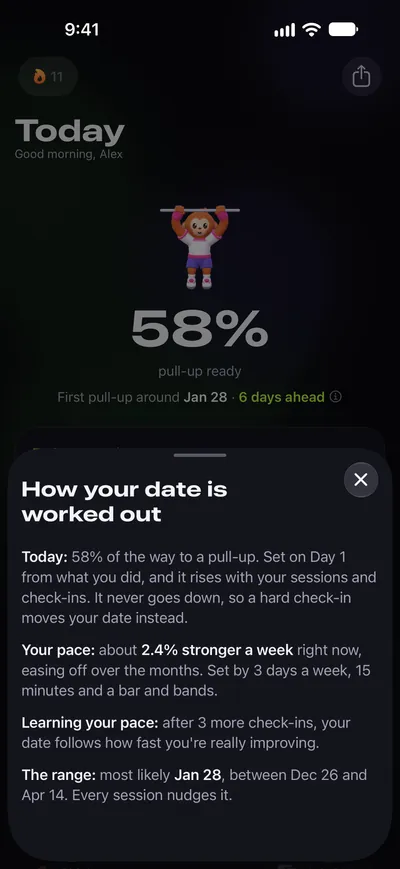
The date is the week your strength reaches 1.0 at that pace, plus half a week to try it. The range is the same sum at a slower pace (×0.6) and a faster one (×1.5). Past a year, the app stops showing a date and talks in milestones: a 30-second hang, then a 10-second slow lower. It’s always labelled an estimate. We never promise a date.
Without a bar, the app shows how many weeks you’d need once you have one, because a strict pull-up needs a bar; until then, the plan builds the same muscles with rows and floor work.
Your own pace
After three check-ins (one every two weeks of training), the date stops assuming you’re average. It compares how fast your strength is really rising with how fast the curve expected, and moves the date by that ratio, trusting it more with every check-in (up to 80%, and never more than 1.8 times faster or half as fast).
What comes from studies, and what’s our choice
Being clear about this is the point of this page.
| Part | Where it comes from |
|---|---|
| Measuring strength as a share of body weight | Studies of pull-ups and pulldowns (Johnson 2009) |
| Sex changes the start, not the pace | A meta-analysis (Roberts 2020) |
| About 2.5% a week over the first 12 weeks | Calibrated to one small study (Flanagan 2003, 17 women) |
| More days, more progress | A meta-analysis (Grgic 2018) and a trial of short sessions (Kilen 2020) |
| The hang and hold ladder, and each stage’s goal | Coach guidance (Beecroft, StrongFirst), set by us |
| The exact size of each factor, the equipment factors, the men’s starting estimate | Our choices. The men’s estimate was set on 2026-10-27 so that, for typical answers, the quiz and Day 1 agree as closely for men as for women |
There is no large study of how long a first pull-up takes. The forecast is our best reading of the studies above, and we’ll keep checking it against how people really progress, and say here when it changes.
How we check it
The app’s tests run the forecast across a matrix of profiles: every input moves the date in one direction only (more days or better kit never makes it later), typical starts land in believable ranges, and the quiz’s estimate and Day 1’s measurement agree within a few points for typical answers. The website’s calculator is a line-for-line copy of the app’s forecast, checked against the same test profiles.
Sources
Each verified at doi.org and Crossref on 2026-10-27; the claims are as docs/research-science.md §2 states them.
- Johnson et al., J Strength Cond Res 2009. https://doi.org/10.1519/JSC.0b013e3181a2d7f5
- Roberts, Nuckols & Krieger, J Strength Cond Res 2020. https://doi.org/10.1519/JSC.0000000000003521
- Flanagan, Vanderburgh et al., Res Q Exerc Sport 2003. https://doi.org/10.1080/02701367.2003.10609064
- Grgic et al., Sports Med 2018. https://doi.org/10.1007/s40279-018-0872-x
- Kilen et al., J Sci Med Sport 2020. https://doi.org/10.1016/j.jsams.2020.03.013
- ACSM position stand, Med Sci Sports Exerc 2026. https://doi.org/10.1249/MSS.0000000000003897
- ACSM progression models, Med Sci Sports Exerc 2009. https://doi.org/10.1249/MSS.0b013e3181915670
- Peterson et al., Ageing Res Rev 2010. https://doi.org/10.1016/j.arr.2010.03.004
- Crockford, ACE expert article, 2015. https://www.acefitness.org/resources/pros/expert-articles/5565/4-moves-to-help-you-master-the-pull-up/
- Beecroft, Breaking Muscle. https://breakingmuscle.com/how-to-nail-your-first-pull-up/
- StrongFirst, K. Smith. https://www.strongfirst.com/progress-first-pull/
Questions
Is the first pull-up date a promise?
No. It’s an estimate from your answers or your measurements, shown with its range. In the app it updates after every workout, and past a year it switches to milestones instead of a date.
Why did my date move after Day 1?
Because Day 1 measures you instead of guessing. It times your hang, top hold, slow lower and rows, and sets your readiness and date from them, up or down.
Why does my date move after a hard check-in?
Your readiness never goes down after Day 1, so when a check-in shows slower progress, the date moves instead. Every session you do brings it closer again.
Why does being a man or a woman change the estimate?
Only the starting point changes: on average, men start with more upper-body strength relative to body weight. Women gain strength at least as fast, so the pace is the same for everyone.
What does 100% readiness mean?
That your estimated strength is enough for one strict pull-up. 0% is pulling about half your body weight.
Which parts of the method are your own choices?
The size of each factor, the equipment factors, the ladder between measurements and the men’s starting estimate. The table above marks each one.
See your own date.
Day 1 is free: it measures your hang, hold and lower, and the date updates after every workout. Pro is $49.99 a year with a free week, or $5.99 a week.
Download on the App Store